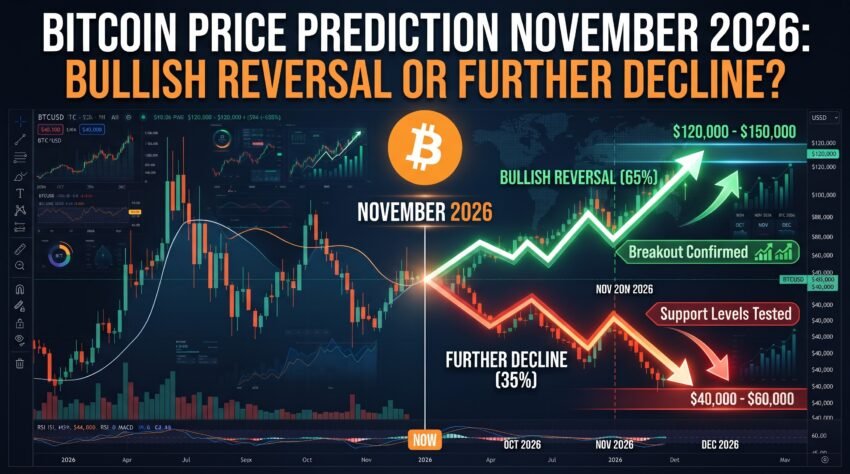
Bitcoin (BTC) enters November 2026 at a critical point in the cryptocurrency market. Investors are watching closely to determine whether the leading cryptocurrency can recover from recent weakness or face another wave of selling pressure.
Bitcoin Price Prediction November 2026: Market Outlook
The main question is whether Bitcoin can regain its upward momentum and move toward $90,000 or even $100,000, or whether weakening demand and unfavorable economic conditions will push the price toward lower support levels.
Several factors could influence Bitcoin’s performance in November, including institutional investment flows, Federal Reserve policy, inflation expectations, market liquidity, and overall cryptocurrency investor sentiment.
Rather than relying on a single price target, investors should consider multiple scenarios and monitor important technical levels before drawing conclusions about Bitcoin’s next major move.
Bitcoin Price Forecast for November 2026
Bitcoin’s November outlook includes bullish, neutral, and bearish possibilities. The following table presents illustrative price scenarios rather than guaranteed forecasts.
| Market Scenario | Potential BTC Price Zone | Key Conditions |
|---|---|---|
| Bullish Breakout | $90,000–$100,000 | Strong buying pressure, improving liquidity, and a confirmed breakout. |
| Neutral Consolidation | $80,000–$90,000 | Mixed market signals and balanced buying and selling. |
| Bearish Correction | $73,000–$80,000 | Weak support, continued selling, and unfavorable macroeconomic conditions. |
These ranges are analytical scenarios, not verified live market prices or guaranteed outcomes. Actual price movements may differ significantly as market conditions change.
1. Bitcoin Technical Analysis: Key Support and Resistance Levels
Technical analysis can help traders identify potential areas where buying or selling pressure may increase. Support and resistance levels are especially important when Bitcoin experiences elevated volatility.
Bitcoin Support at $80,000–$82,000
The $80,000–$82,000 region is an important support zone to monitor in the bullish and bearish scenarios discussed for November 2026.
If Bitcoin holds above this area and buyers return with stronger trading volume, BTC could attempt a recovery toward higher resistance levels. However, a temporary rebound does not automatically confirm a bullish reversal.
Bitcoin Price Risk Below $80,000
If Bitcoin breaks below the $80,000 support area and fails to recover, bearish sentiment could strengthen. Traders may begin watching the $73,000–$75,000 region as a potential downside reference point.
This level is not a guaranteed price floor. A broader cryptocurrency sell-off or a deterioration in global financial conditions could push Bitcoin even lower.
Bitcoin Resistance at $90,000
The $90,000 level is an important psychological price threshold to watch. A sustained move above it could indicate that buyers are regaining control of the market.
Traders should look for confirmation through trading volume, sustained price strength, and evidence of spot-market demand. A brief move above resistance followed by a rapid decline could represent a false breakout.
Could Bitcoin Reach $100,000 in November?
Bitcoin could potentially approach $100,000 if institutional demand improves, broader market conditions become more supportive, and BTC breaks above important resistance levels.
However, reaching this target would likely require sustained buying pressure. Investors should not treat $100,000 as a guaranteed price prediction.
2. Institutional Bitcoin ETF Flows Could Determine the Next Move
Institutional investment is one of the important factors influencing Bitcoin’s price outlook in 2026. U.S. spot Bitcoin exchange-traded funds provide investors with a regulated way to gain exposure to BTC without directly holding the cryptocurrency.
Sustained ETF net inflows may contribute to additional Bitcoin demand, while persistent outflows can indicate weaker investor interest or reduced exposure.
Investors should monitor three important indicators:
- Daily ETF net flows: Consistent positive flows may support a recovery, while persistent outflows could increase selling pressure.
- Spot-market buying: Strong spot demand can provide evidence of accumulation beyond movements driven primarily by leveraged trading.
- Institutional positioning: Changes in institutional exposure may help reveal whether large investors are becoming more confident or cautious.
ETF inflows alone cannot guarantee a Bitcoin rally. Their impact depends on the broader balance between buyers and sellers across cryptocurrency markets.
3. Federal Reserve Policy and Inflation Remain Major Risks
Bitcoin’s performance is closely connected to broader financial conditions. When interest rates are high or investors expect monetary tightening, risk-sensitive assets can experience additional pressure.
Persistent inflation could limit the Federal Reserve’s flexibility to reduce interest rates. Expectations of tighter monetary policy may strengthen the U.S. dollar and reduce demand for speculative assets.
For November 2026, investors should monitor:
- U.S. inflation reports and inflation expectations.
- Federal Reserve communications and interest-rate expectations.
- U.S. Treasury yields and the strength of the dollar.
- Employment data and broader economic conditions.
- Global liquidity and investor risk appetite.
Improving financial conditions could support Bitcoin, while prolonged monetary tightening could increase the risk of another correction. However, the relationship between interest rates and cryptocurrency prices is complex and can change over time.
4. Bitcoin Market Sentiment: Is a Bullish Reversal Developing?
Market sentiment can change rapidly in cryptocurrency markets. A bullish reversal becomes more convincing when several indicators improve together rather than when the price simply rebounds for a short period.
Signs That Could Support a Bullish Reversal
- Higher lows: Bitcoin begins forming progressively higher lows, suggesting that buyers are entering at higher prices.
- A breakout above resistance: BTC moves above $90,000 and maintains strength with meaningful volume.
- Improving ETF inflows: Consistent institutional demand helps absorb selling pressure.
- Stronger market breadth: Other major cryptocurrencies begin recovering alongside Bitcoin.
- Reduced selling pressure: Spot demand stabilizes while aggressive selling declines.
Warning Signs That Bitcoin Could Decline Further
The bearish outlook would strengthen if Bitcoin repeatedly failed to recover above resistance and eventually lost the $80,000–$82,000 support area.
- Persistent Bitcoin ETF outflows.
- Weak spot-market volume during attempted recoveries.
- Increasing selling pressure across major cryptocurrencies.
- Deteriorating macroeconomic conditions.
- Sharp increases in leveraged liquidations.
Investors should be cautious when a rebound is driven mainly by short covering rather than sustained buying demand. Such rallies may struggle to continue once the initial buying pressure disappears.
5. Three Bitcoin Price Scenarios for November 2026
Scenario One: Bullish Recovery Toward $90,000–$100,000
In the bullish scenario, Bitcoin successfully defends the $80,000–$82,000 support area and attracts stronger buying interest.
Improving institutional inflows, supportive macroeconomic conditions, and a decisive breakout above resistance could encourage a move toward $90,000. If Bitcoin establishes support above that level, the $95,000–$100,000 region could become a potential upside target.
Bullish confirmation: Bitcoin maintains support, breaks above $90,000, and demonstrates continued buying pressure.
Scenario Two: Sideways Trading Between $80,000 and $90,000
In the neutral scenario, Bitcoin remains volatile without establishing a clear directional trend. Buyers defend support while sellers continue taking profits near resistance.
This environment could produce repeated price swings as traders respond to economic reports, ETF flows, and changing monetary policy expectations.
Neutral confirmation: BTC repeatedly trades within the range without a sustained breakout above resistance or breakdown below support.
Scenario Three: Bearish Correction Toward $73,000–$75,000
The bearish scenario becomes more plausible if Bitcoin loses the $80,000–$82,000 support area and selling pressure continues.
Weak ETF demand, persistent inflation, and expectations of tighter monetary policy could contribute to deteriorating market sentiment. Traders may then monitor $73,000–$75,000 as a potential area where buyers could attempt to stabilize the market.
However, support zones can fail, and a stronger market sell-off could push Bitcoin below this range.
Bearish confirmation: Bitcoin breaks below support, fails to reclaim it, and continues declining amid weak demand.
6. Could Bitcoin’s Four-Year Cycle Affect November 2026?
Bitcoin’s historical market cycles are another factor investors may consider when evaluating the November outlook.
Previous cycles have included periods of strong appreciation followed by substantial corrections and extended consolidation. The Bitcoin halving is commonly associated with these cycles because it reduces the rate at which new BTC enters circulation.
The most recent Bitcoin halving occurred in April 2024. Some market participants use historical patterns following previous halvings to estimate Bitcoin’s potential performance in 2026.
However, historical patterns are not reliable timing signals on their own. Institutional investment products, derivatives markets, corporate holdings, and macroeconomic conditions have changed Bitcoin’s market structure.
The four-year cycle may provide historical context, but it cannot independently establish whether November 2026 will bring a bullish reversal or further decline.
7. What Could Drive Bitcoin Higher in November 2026?
Renewed Institutional Demand
Stronger inflows into spot Bitcoin ETFs could signal renewed interest from institutional and traditional financial investors. Consistent buying would be especially encouraging if accompanied by rising spot-market volume.
Improved Macroeconomic Conditions
Lower inflation expectations, easier financial conditions, or a more supportive interest-rate outlook could improve demand for risk assets.
Stronger Cryptocurrency Market Liquidity
Growing stablecoin supply and increased trading activity can support cryptocurrency market liquidity. However, additional liquidity does not guarantee that capital will flow into Bitcoin.
Positive Regulatory Developments
Greater regulatory clarity could support participation by institutions and investors who prefer clearer rules for cryptocurrency ownership, trading, and custody.
A Breakout Above Key Resistance
Improving fundamentals should eventually be reflected in price action. A sustained breakout above $90,000 would provide stronger technical evidence of recovery than a temporary price spike.
8. What Could Push Bitcoin Lower in November 2026?
Higher Interest-Rate Expectations
If inflation remains elevated, investors may anticipate tighter monetary policy. Higher expected borrowing costs and yields could weigh on demand for risk-sensitive assets.
Continued ETF Outflows
Persistent outflows from spot Bitcoin ETFs could indicate that investors are reducing their exposure. Bitcoin may struggle to maintain support if institutional selling coincides with weaker retail demand.
A Stronger U.S. Dollar
A strengthening dollar can coincide with tighter financial conditions and weaker appetite for speculative investments. Although this relationship is not consistent in every market environment, it remains worth monitoring.
Excessive Leverage
Cryptocurrency derivatives markets can amplify price movements. When prices decline rapidly, leveraged traders may face forced liquidations, creating additional selling pressure.
Broader Financial Market Uncertainty
Geopolitical tensions, unexpected economic data, or deteriorating global market sentiment could trigger a flight toward assets investors perceive as less risky.
9. Bitcoin Market Indicators to Watch in November 2026
Investors should monitor several indicators throughout November to determine whether Bitcoin’s outlook is improving or deteriorating.
| Indicator | Bullish Signal | Bearish Signal |
|---|---|---|
| BTC Price Action | Sustained recovery above resistance | Breakdown below major support |
| Bitcoin ETF Flows | Consistent net inflows | Persistent net outflows |
| Trading Volume | Strong volume during breakouts | Weak demand during rebounds |
| Inflation Expectations | Cooling inflation pressure | Persistent inflation concerns |
| Interest-Rate Outlook | Expectations of easier policy | Expectations of tighter policy |
| Market Structure | Higher lows and stronger momentum | Lower highs and continued selling |
These indicators should be evaluated together rather than in isolation. Bitcoin may rise temporarily even when ETF flows are weak, while strong institutional inflows may not immediately translate into higher prices if broader selling pressure remains intense.
10. Is November 2026 a Good Time to Buy Bitcoin?
Whether November represents an attractive buying opportunity depends on an investor’s strategy, risk tolerance, time horizon, and financial circumstances.
Short-term traders may prefer to wait for confirmation that Bitcoin has established support or broken above resistance. Long-term investors may instead evaluate whether current prices fit their investment plans without attempting to predict the exact market bottom.
Buying after a sharp decline does not guarantee that the price will recover. Bitcoin can experience further corrections, and investors may face substantial losses if market conditions deteriorate.
Anyone considering an investment should assess the potential downside, avoid excessive leverage, and refrain from committing money they cannot afford to lose.
This article is for informational and educational purposes only and should not be considered financial or investment advice.
Frequently Asked Questions (FAQ)
1. What is the Bitcoin price prediction for November 2026?
Bitcoin’s November 2026 outlook includes three broad scenarios: a bullish recovery toward $90,000–$100,000, sideways trading between approximately $80,000 and $90,000, or a bearish correction toward $73,000–$75,000. These are illustrative scenarios rather than guaranteed outcomes.
2. Will Bitcoin go up in November 2026?
Bitcoin could rise if institutional demand improves, market liquidity strengthens, and BTC breaks above important resistance levels. Persistent inflation, tighter monetary policy expectations, or continued selling could prevent a sustained recovery.
3. Can Bitcoin reach $100,000 before the end of 2026?
Bitcoin could potentially reach $100,000 if buying demand strengthens and the price establishes a sustained breakout above major resistance. However, the target remains uncertain and is not guaranteed.
4. What is the most important Bitcoin support level for November 2026?
The $80,000–$82,000 region is an important near-term support area to monitor. If Bitcoin loses this zone, the $73,000–$75,000 region becomes another area to watch. Neither zone guarantees a price floor.
5. What happens if Bitcoin falls below $80,000?
A sustained breakdown below $80,000 could increase selling pressure and weaken the bullish outlook. Traders may then monitor the $73,000–$75,000 region for potential stabilization.
6. Will the Federal Reserve affect Bitcoin in November 2026?
Yes. Interest-rate expectations, inflation data, Treasury yields, and broader financial conditions can influence Bitcoin demand. However, Bitcoin can also move independently of these factors over shorter periods.
7. Is Bitcoin bullish or bearish heading into November 2026?
The outlook remains conditional rather than definitively bullish or bearish. A sustained recovery above $90,000 would strengthen the bullish case, while a breakdown below the $80,000–$82,000 support area would increase downside risks.
Final Verdict: Bullish Reversal or Further Decline?
Bitcoin’s November 2026 outlook will likely depend on whether buyers can defend near-term support and generate enough demand to overcome selling pressure.
The bullish scenario remains possible if institutional inflows improve, economic conditions become more supportive, and BTC establishes a sustained breakout above $90,000. Under those conditions, a move toward $100,000 could become a potential upside target.
However, the bearish scenario cannot be dismissed. Persistent inflation concerns, weaker ETF demand, and a breakdown below $80,000–$82,000 could expose Bitcoin to a deeper correction toward $73,000–$75,000.
For now, the most useful approach is to focus on confirmation rather than prediction alone. A sustained breakout would strengthen the recovery thesis, while a confirmed support breakdown would signal that downside risks remain elevated.
The key question for November is not simply how high Bitcoin can rise, but whether the market can build enough demand to support a lasting recovery.
Bitcoin remains a volatile asset. Investors should conduct their own research and consider their risk tolerance before making investment decisions.