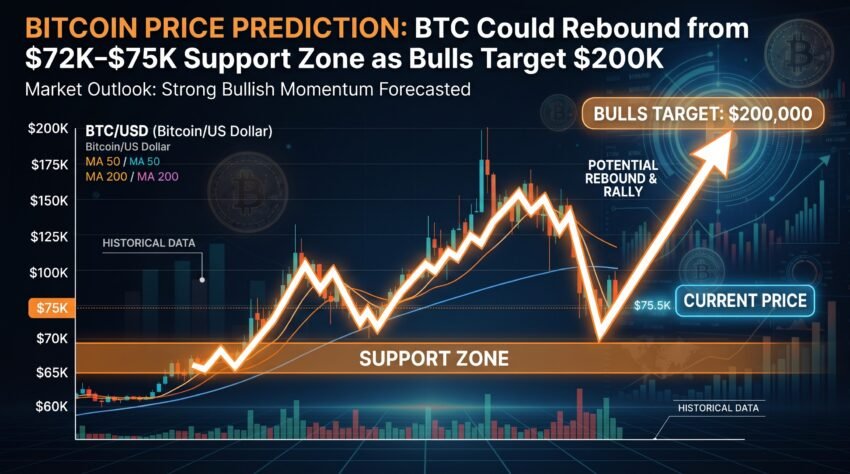
Bitcoin (BTC) is attracting attention as traders monitor a potential reversal from the $72,000–$75,000 support zone. According to a technical analysis chart circulating among cryptocurrency traders, Bitcoin could attempt to recover toward $90,000 if buyers successfully defend this key area.
The same analysis presents a more ambitious long-term bullish scenario, with potential price targets ranging from $150,000 to $200,000 during a future bull run.
However, these targets remain speculative. Bitcoin’s next major move will depend on market demand, trading volume, macroeconomic conditions, and whether the cryptocurrency can establish a sustainable recovery above important resistance levels.
Bitcoin Price Analysis: Why the $72K–$75K Zone Matters
The chart highlights the $72,000–$75,000 region as a potential support zone. In technical analysis, support is a price area where buying interest may increase and help slow a downward trend.
Bitcoin was shown trading around $77,362 in the supplied screenshot, placing the market relatively close to the highlighted support area. This price is taken from the image and should not be interpreted as a verified live market quote.
If BTC declines toward this zone, traders may watch for signs of buying pressure, including bullish candlestick patterns, stronger trading volume, and a recovery above short-term resistance.
A successful bounce could indicate that buyers are attempting to regain control of the market.
Nevertheless, support levels are not guaranteed to hold. If Bitcoin breaks below the zone with strong selling pressure, the market could experience another downward move.
Can Bitcoin Rebound Toward $90,000?
One of the main scenarios illustrated in the chart is a potential Bitcoin recovery toward $90,000.
For this scenario to become more convincing, BTC would need to defend support and demonstrate sustained buying momentum. A temporary price increase alone would not confirm the beginning of a new bull run.
Several technical signals could strengthen the bullish outlook:
- Support holds: Bitcoin maintains buying interest around $72,000–$75,000.
- Bullish price action develops: BTC forms a credible reversal pattern after testing support.
- Trading volume increases: More market participants support the recovery.
- Resistance levels are reclaimed: Bitcoin moves above nearby resistance and maintains its gains.
- Market sentiment improves: Buyers become more confident about the broader cryptocurrency market.
If these conditions align, a move toward $90,000 could become a potential upside scenario. However, traders should also consider the possibility of a failed rebound.
Bitcoin Bullish Scenario: Could BTC Reach $150K–$200K?
The chart also highlights a long-term bullish target between $150,000 and $200,000.
Such a move would represent a substantial increase from the price displayed in the screenshot. Reaching these levels would likely require sustained demand, favorable market conditions, and a broader expansion in cryptocurrency investment.
1. Institutional Demand
Continued participation from institutional investors could support Bitcoin demand. However, institutional interest can fluctuate, and it does not guarantee that prices will rise.
2. Bitcoin Supply Dynamics
Bitcoin has a maximum supply of 21 million coins. Its limited supply is an important part of the asset’s investment narrative, although scarcity alone does not determine market price.
3. Macroeconomic Conditions
Interest rates, inflation expectations, liquidity, and global risk appetite can influence cryptocurrency prices. More favorable financial conditions could help support risk assets, while tighter conditions may put pressure on them.
4. Market Momentum
A sustained break above major resistance levels could attract additional buyers and improve market sentiment. Conversely, weakening momentum may delay or invalidate a bullish scenario.
Although $150,000–$200,000 is an ambitious target, it should be treated as a speculative long-term possibility rather than a guaranteed outcome or a confirmed price forecast.
What Happens If Bitcoin Breaks Below $72,000?
A bearish scenario must also be considered when evaluating the Bitcoin price prediction.
If Bitcoin falls below the highlighted support zone and fails to recover quickly, the previous support area could become resistance. This development could weaken the bullish outlook and increase the risk of further downside.
In that situation, traders may look for the next significant support levels using historical price action, trading volume, and broader chart structures.
A breakdown accompanied by heavy selling volume could indicate that sellers remain in control.
For this reason, traders should avoid assuming that every decline toward support will produce a profitable buying opportunity. Confirmation is important, particularly in a volatile market such as cryptocurrency.
Bitcoin Price Scenarios to Watch
The following table summarizes the scenarios suggested by the supplied chart. These are analytical reference points, not verified forecasts or guaranteed outcomes.
| Bitcoin Price Level | Potential Significance | What Traders Should Watch |
|---|---|---|
| $72,000–$75,000 | Potential support zone | Buying pressure and reversal signals |
| $77,000–$80,000 | Near-term price region | Whether BTC can maintain a recovery |
| $90,000 | Potential upside target | Resistance breakout and sustained momentum |
| $150,000–$200,000 | Speculative long-term bullish target | Broader market expansion and sustained demand |
| Below $72,000 | Potential support breakdown | Selling pressure and the next support areas |
These levels are based on the supplied chart and its accompanying commentary. They have not been independently confirmed as current market levels.
Is Bitcoin Entering a New Bull Run?
A bounce from support alone is not enough to confirm a new Bitcoin bull run. Traders often look for a combination of higher highs, higher lows, stronger volume, and successful breaks above important resistance levels.
Market conditions outside the chart also matter. Bitcoin can experience sharp rallies during a broader downtrend, just as it can consolidate for extended periods before making another major move.
Investors should therefore distinguish between a short-term technical rebound and a sustained bullish market structure.
If BTC defends support and continues to establish higher price levels, the bullish outlook may strengthen. If support fails and selling pressure increases, the market may need more time to recover.
Frequently Asked Questions About Bitcoin Price Prediction
Can Bitcoin recover from $72,000–$75,000?
A recovery is possible if buyers defend the zone and technical signals support a reversal. However, the price area is not guaranteed to hold.
Is $90,000 the next Bitcoin price target?
The supplied chart identifies $90,000 as a potential upside target following a successful rebound. Bitcoin would still need to overcome resistance and maintain upward momentum.
Can Bitcoin reach $150,000 or $200,000?
These levels represent a speculative long-term bullish scenario. Reaching them would require substantial market appreciation and favorable conditions. There is no guarantee that either target will be achieved.
What happens if BTC falls below $72,000?
A confirmed breakdown could weaken the bullish scenario and expose Bitcoin to further downside. Traders would need to assess additional support levels and broader market conditions.
Is this a good time to buy Bitcoin?
That depends on an individual’s investment objectives, risk tolerance, and strategy. The chart alone is insufficient to determine whether Bitcoin is a suitable purchase. Investors should consider the possibility of further losses and avoid investing money they cannot afford to lose.
Final Thoughts
Bitcoin is approaching a price region that the supplied technical analysis identifies as potential support between $72,000 and $75,000. If this area holds and buying momentum strengthens, BTC could attempt a recovery toward $90,000.
The longer-term bullish scenario points to potential targets of $150,000–$200,000, but those levels remain speculative and would require a much larger market advance.
For now, the key question is whether Bitcoin can establish a convincing reversal or whether selling pressure will push the price below support.
Disclaimer: This article is for informational and educational purposes only. It does not constitute financial or investment advice. Cryptocurrency markets are highly volatile, and readers should conduct independent research before making investment decisions.